
Article • Tissue analysis
Infrared spectroscopy as a diagnostic tool
New techniques of infrared-based technology are showing strong potential for cost-effective tissue analysis.
Report: Mark Nicholls
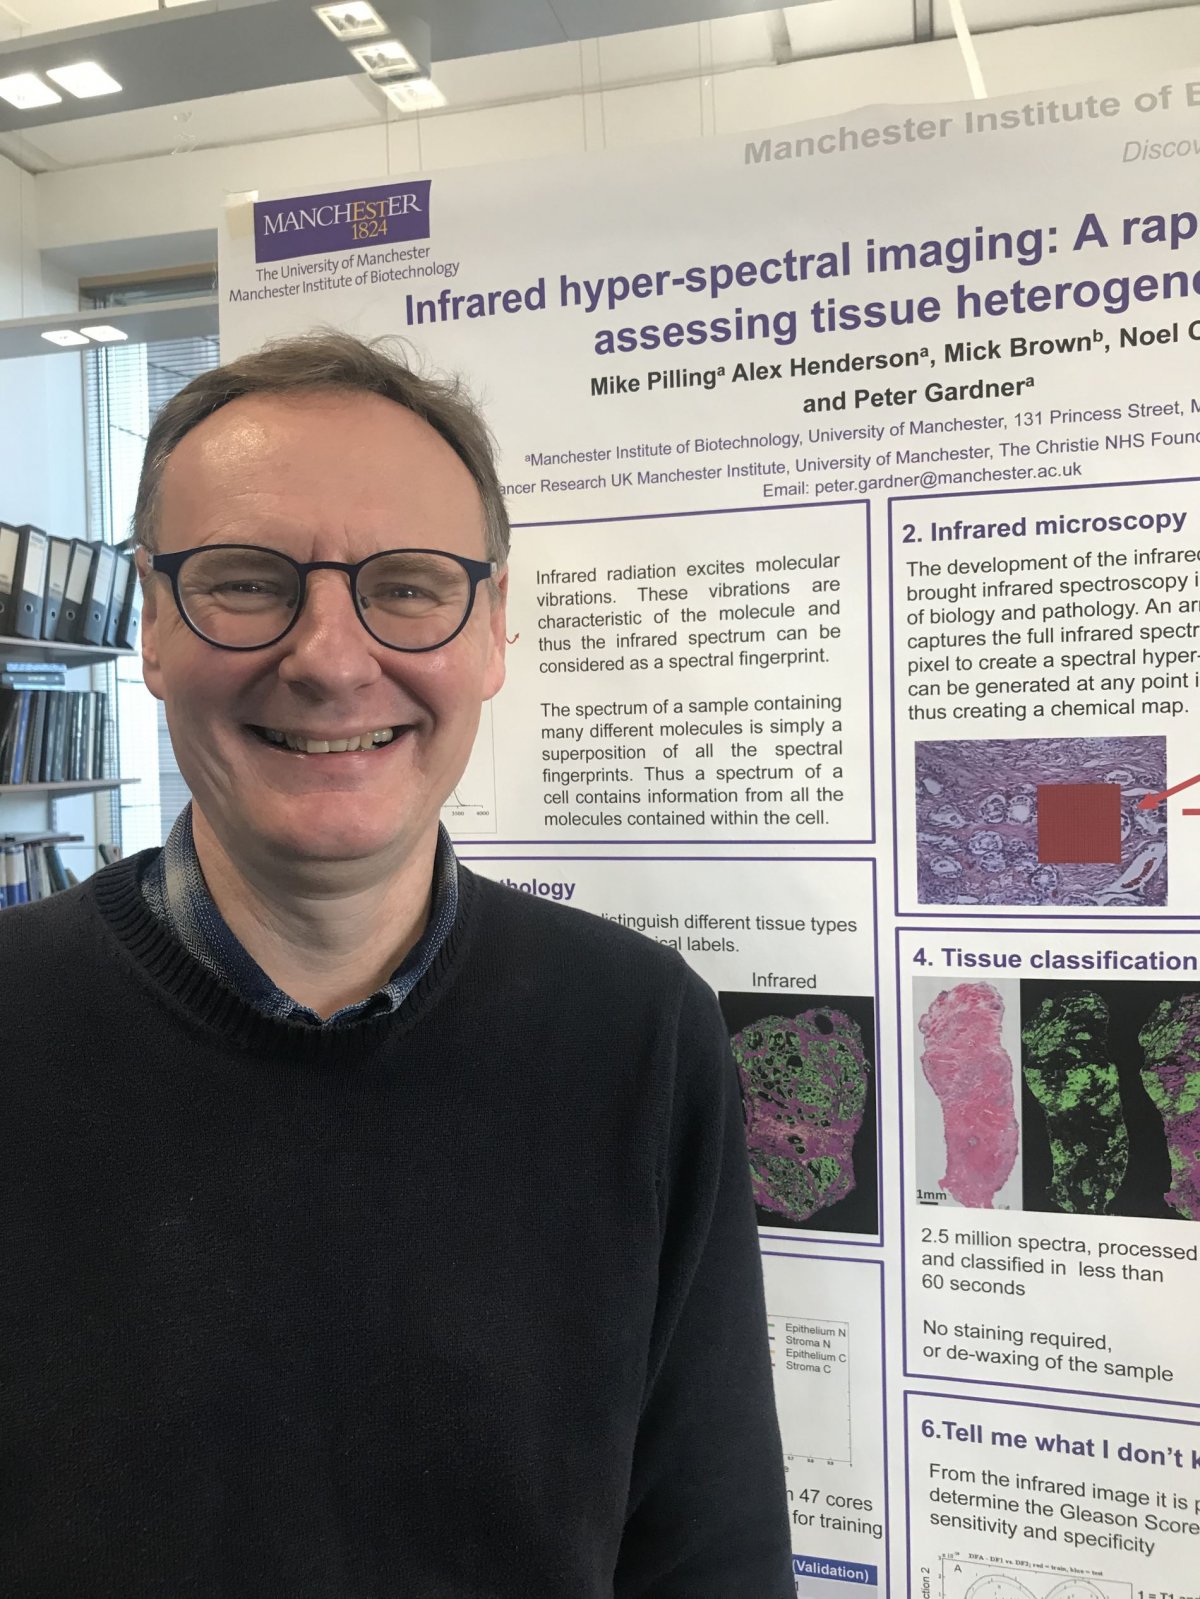
Peter Gardner, Professor of Analytical and Biomedical Spectroscopy at the University of Manchester, outlined how hyperspectral imaging coupled with sophisticated computer algorithms can identify and grade cancerous tissue, as well as offer an indication of prognosis. The technique, he said, speaking at the 6th Digital Pathology and AI Congress in London last December, lends itself to automation and would be particularly useful to screen large numbers of biopsy samples for common cancers, such as prostate cancer.
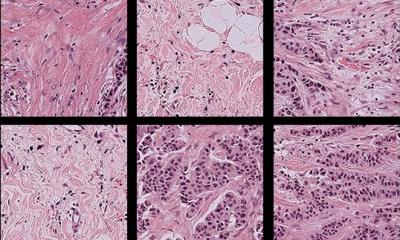
Posing the question ‘Infrared spectral pathology – an academic exercise or a new diagnostic tool?’, he explained that infrared micro-spectroscopy uses an array detector with the image of the sample focused onto an array of MCT (Mercury Cadmium Telluride) detectors, so that spectra from each point on the sample can be obtained simultaneously. ‘All tissue contains molecules that vibrate, particularly if you shine infrared light through them,’ explained Gardner. The infrared light is absorbed and if we measure this, we obtain an absorption spectrum. Because we have thousands of pixels in our image we have thousands of spectra and this makes up our data.’
Reducing error rates
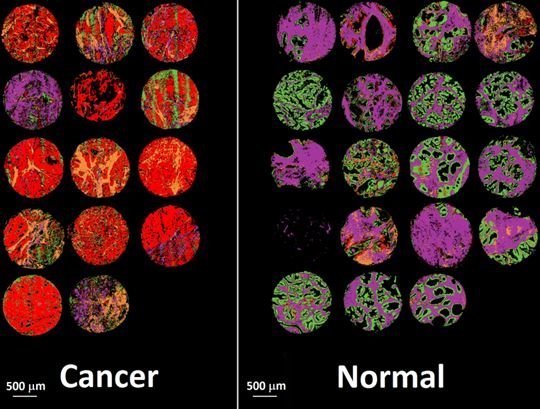
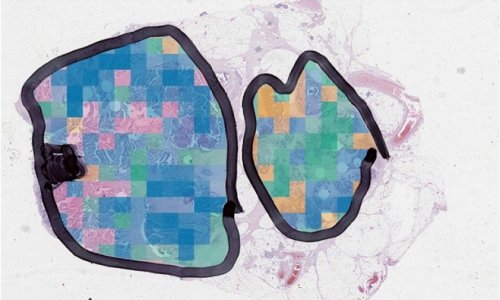
False colour image of the classified prostate tissue cores based on their infrared spectra:
Red = malignant epithelium,
Orange = cancer associated stroma,
Green = normal epithelium,
Purple = normal stroma.
Focusing on prostate cancer, the team liaised with pathologists over the technique with feedback suggesting that pre-screening with infrared micro-spectroscopy would help focus on the most important cases and that automated pre or post screening of biopsy samples could reduce error rates. However, Gardner stressed, ‘If looking at tissue with infrared spectroscopy, we cannot pin down individual proteins – this is not mass spectrometry – but we can get a spectroscopic fingerprint that might be indicative of something in the tissue. The question is, is the fingerprint different enough to say something about that tissue? We can get spectral evidence of that tissue and the image has evidence of the peaks in that tissue – we can see the protein peak, for example.’
He acknowledged that spatial resolution is an issue – the best is about five microns – simply because the wavelength of light is longer than visible light, but the research team believe this is still enough to obtain key spectroscopic information. With no need for stains or dyes, he said, grading for cancer can be shown as well as prognostic information. ‘For a two-band criterion looking at stages T1 and T2 against T3 and T4, we can obtain sensitivities and specificities of 91% and 93% respectively,’ he added. He outlined how spectral information reveals primary tumour behaviour and whether it is invading surrounding tissue. Infrared identification of the tissue pathology highlighted the epithelium, smooth muscle, lymphocytes, blood, extracellular matrix, concretion and fibrous stroma.
With 2.5 million spectra processed and classified in less than 60 seconds with no staining needed, or de-waxing of the sample, a drawback is the requirement for infrared transparent substrates for pristine results. Despite this, the research team has shown that reasonable results and diagnostic information could be obtained using standard 1mm glass slides just from the region of spectrum using epithelial pixels. Furthermore, the researchers showed that ‘reasonably good’ classifications of stroma and epithelium could be obtained directly from heavily H&E stained tissue.
Gardner – who believes the technology is almost ready for clinical translation – concluded: ‘Infrared spectral pathology can be used to analyse tissue and provide diagnostically useful information. A preliminary study shows H&E gives enough information to provide initial screening and extremes of staining make no significant difference, though the type of glass does, although that can be standardised.’
Profile:
Peter Gardner is Professor of Analytical and Biomedical Spectroscopy and a fellow of the Royal Society of Chemistry at the University of Manchester. He heads a successful biomedical spectroscopy group that focuses on the development of vibrational spectroscopy methods for use in pathology and has demonstrated the utility of the technique for both prostate and breast cancer samples.
17.09.2020