
Turbulences in ultrasound
Ultrasound expands its role in cardiac imaging with disruptive applications. Fasten your seat belt. Cardiac diagnostics is entering a zone of turbulence. Manufacturers of leading systems continue to mine data from the sonic signal that opens new fields for research. John Brosky reports
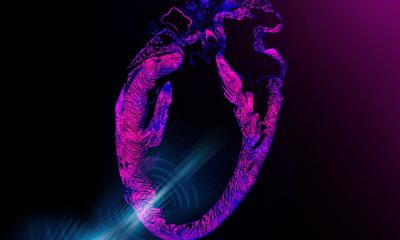
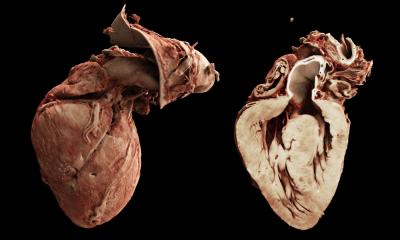
By merging the stunning three-dimensional (3-D) images with traditional X-ray, new systems are providing novel capabilities for diagnosis and navigation. ‘I believe that 3-D echo is the cornerstone for the non-invasive diagnosis of cardiac diseases,’ says Jose Zamorano MD, head of Cardiology at the University Hospital Ramón y Cajal in Madrid. ‘There can be no doubt. You can see the anatomy of the heart, and you can see the function.’ He cites as an example the turbulence created by blood flow in the cavities of the heart that is now revealed by technology called vector flow mapping developed by Hitachi-Aloka.
The heart is not a simple pump but a hard-working muscle, twisting, contracting and pushing a pulsing stream of blood. A closer look shows that this flow is not so simple either, swirling and churning in intricate patterns as it encounters resistance.
Nobel Laureate Richard Feynman once described turbulence as the most important unsolved problem of classical physics. It may also be the key to unlocking unsolved problems in cardiac diagnosis.
‘It’s back to physiology,’ Dr Zamorano said. ‘From the work in our lab we can now see the vectors and the vortices for normal blood flow, and we have seen the way turbulence is affected by abnormal physiology and different pathologies… What is certain is that this will help in evaluation, and it could become a prognostic indication for the patient. It opens a new area of research to correlate what we are observing with the pathologies of patients.’
Vector flow mapping is an innovative ultrasound application derived from colour Doppler velocity data that adds new mathematical methods to display flow distribution without angle dependency. This quantification tool enables researchers at the University Hospital Ramón y Cajal to visualise, measure and analyse more than a dozen parameters of blood flow distribution.
‘Most people think that Doppler ultrasound is an analysis of the blood flow itself, but we need to clarify this understanding, because Doppler only shows velocity,’ Dr Zamorano explained. ‘With vector flow mapping you truly can see how the blood behaves entering the left ventricle and how it is ejected into the system.’
In the case of an aortic stenosis, he pointed out that the turbulence which appears in the left ventricle outflow is characteristic and ‘absolutely different from a normal patient’.
Research is currently being conducted using a two-dimensional ultrasound system and while the technology is not yet ready to show the flow in 3-D, he is confident this product evolution will come.
In early September, at the European Society of Cardiology (ESC) Congress in Amsterdam, Dr Zamorano will discuss the evaluation of valvular heart disease in 3-D with echography. ‘Valve anatomy is in three dimensions and 3-D echo assesses the morphology of the valve much more accurately than other modalities,’ he explained.
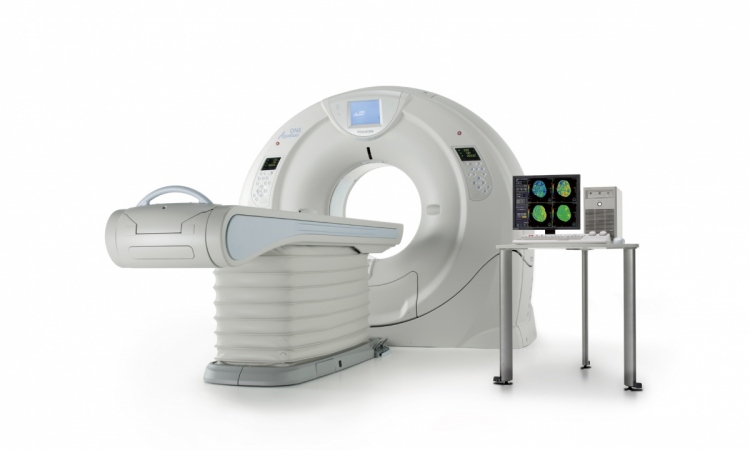
Fusion imaging that combines 3-D echo images with 3-D CT scans today provides a complete picture of the heart for cardiologists. The CT view of the coronary arteries of a patient can help determine if there is a coronary disease and at which level, he pointed out, while 3-D echo displays the abnormal function that is related to that stenosis.
In the cardiovascular research facility in Madrid, he is currently testing a new advance in fusion imaging developed by Toshiba for its CardioVascularFusion (CVI-Fusion) system that creates a revolutionary capability for the assessment of ischaemia. ‘At ESC we will reveal a new technique, one that is quite unique, and which no one else is doing,’ he promised. ‘We will demonstrate the feasibility of using stress echo in fusion imaging, which in my opinion becomes crucial. Stress echo induces ischaemia, but here for the first time we will show the ischaemia. ‘By combining these views we can see the stenosis, the location of the stenosis and now how the stenosis impacts on the prognosis.’ The technique is a non-invasive complement to fractional flow reserve (FFR), which is an invasive procedure, he added.
While FFR is given the highest recommendation in ESC guidelines, the invasive nature of the procedure to assess ischaemia has slowed its adoption.
Dr Zamorano reserved his greatest enthusiasm for advances in ultrasound for the newest arrival in the university hospital, the EchoNavigator from Philips Healthcare: ‘I just came from performing two TAVI interventions and can say this system is incredible, very innovative.
‘Usually we work with X-ray in a cath lab but now, by superimposing real-time 2-D and 3-D interventional echo on the fluoroscopy, I can see the valves opening and closing… Remember that with X-ray we can’t see the valve; we can see only calcium.
Now I can mark exactly where the valve needs to be positioned. Using fluoroscopy I can guide the catheters to that precise position.’
Opening a window on the heart
Recent advances in echocardiography, especially tissue Doppler imaging and speckle tracking, have sharpened the focus on cardiac muscle. Yet, there has not been a link established between the observed blood flow and morphological patterns in the myocardium and cardiac cavities.
Now that link is being observed and quantified using a novel and non-invasive technique developed by Hitachi Aloka called Vector Flow Mapping (VFM). ‘With vector flow you really see how blood behaves, which is not something we have seen before,’ explained Jose Zamorano MD. Contracting muscle fibres and the chambers of the heart create vortices and turbulence that are specific to patient pathologies, he added.
In his studies using VFM he has documented how the turbulence inside the left ventricle is different and characteristic if the patient presents with a disease such as severely depressed ejection fraction after an infarction compared to a patient with a normal left ventricle but an aortic stenosis. VFM begins with velocity data derived from colour Doppler echography to generate velocity fields on a 2-D image. Engineers at Hitachi Aloka then moved beyond data received in the direction of the beam by applying unique algorithms that enable an estimation of the radial component. Now the flow distribution can be displayed without angle dependency.
In addition to displaying flow distribution through vectors, VFM also provides the mainstream lines. The application can detect and display the intra-cardiac vortices and quantify the different parameters.
Suddenly a window on the heart opens to reveal the intricate interactions at the interface between pulsing blood and cardiac fibres. This data can be visualised, measured and analysed across a complex array of parameters that describe the spatial and temporal distribution of blood flow. In other words, this data can be translated into diagnostic and prognostic information to inform clinical decisions, according to Partho Sengupta MD, lead author of an article entitled, ‘Emerging Trends in CV Flow Visualisation,’ published in the Journal of the American College of Cardiology.
Profile:
Jose Luis Zamorano Gomez MD is the Head of Cardiology at the University Hospital Ramón y Cajal in Madrid. A Fellow of the European Society of Cardiology (ESC), currently he is the Chair of the ESC Guidelines Committee and a past-President of the European Association of Echocardiography of the ESC.
30.08.2013