
Article • High-capacity digital image analysis
Spatial statistics extract subvisual features
Spatial analytics offers greater clarity in the assessment of tumours beyond routine microscopic analysis.
Report: Mark Nicholls
High-capacity digital image analysis enables new methods of spatial statistics to extract features not immediately distinguishable by visual inspection. These subvisual features reflect complex properties, such as intratumour heterogeneity and have the additional benefit that they can target specific compartments in the tumour micro-environment. Advances in this field were detailed in a recent webcast organised by Global Engage and sponsored by Indica Labs, which focused on research that has identified novel prognostic signatures using new spatial analysis and machine learning to measure tumour-immune cell interactions within the tumour immune micro-environment.
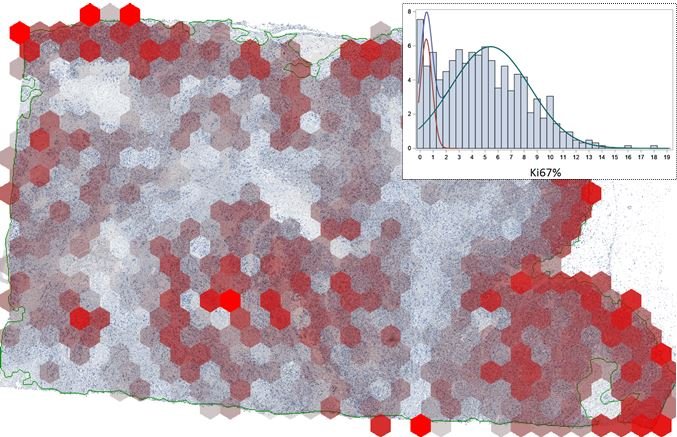
In his presentation ‘Assessment of Intratumour Heterogeneity and Tumour/Host Interaction using Spatial Analytics’, Arvydas Laurinavicius, Professor of Pathology at Vilnius University, outlined his team’s work on spatial image analytics work based on hexagonal grid subsampling of digital image data. He highlighted how machine reading can generate much more data on the proliferation rate and its spatial heterogeneity in breast cancer compared to conventional microscopic assessment. This enables much richer data sets for further analyses, generated from routine pathology slides.
He further explained that subsampling of image analysis data into hexagonal grid tiles provides good opportunities to appraise the tumour texture, the so-called Haralick entropy, which estimates the spatial heterogeneity or ‘disarrangement’ of tumour proliferation rate.
Two analytical models
‘We have developed two analytical models based on hexagonal tiling of image analysis data,’ Laurinavicius added. ‘They enable quantification of subvisual features of intratumor heterogeneity and tumour/host interaction; furthermore, these two methodologies can be combined for integrated prognostic models. We compute spatial entropy of biomarker expression based on the co-occurrence matrix built from all six neighbours to each hexagon.’
Beside the Ki67 heterogeneity indicators obtained by hexagonal tiling, which outperform proliferation rates, he said it is possible to visualise and measure ‘Pareto hotspots’, which represent the ‘hottest 20%’ of the proliferative area in the tumour. ‘We have published and unpublished data which indicate that heterogeneity measurement is more informative than the level of biomarker expression itself, even in the hotspots,’ he explained.
In appraising tumour-host interaction, Laurinavicius stressed the importance of looking for best methods to measure tissue immune response features. A well-established ‘Immunoscore’ system has been shown to provide independent prognostic value in colorectal cancer; remarkably, assessment of the tumour immune microenvironment may significantly improve the prognostic and predictive power of testing in solid tumours, compared to current clinical routine. This will guide individual therapy decisions, in particular, to benefit from new cancer immunotherapy options.
In another example, Laurinavicius pointed to the value of ‘tissue phenomics’ to predict prostate cancer recurrence, by the appraisal of immune cell densities and distances within automated tumour gland/stroma outline and fixed zones around the outline.
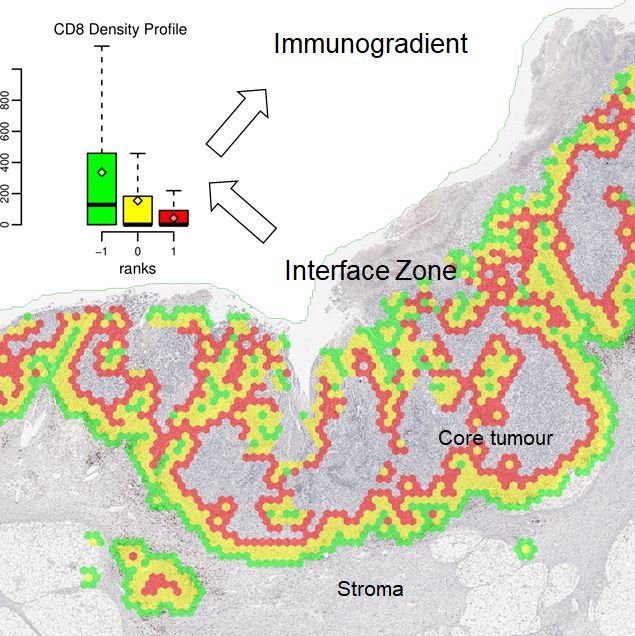
Focus then turned to a recently published study in breast and colorectal cancer patient cohorts and novel Interface Zone Immunogradient indicators computed from tumour infiltrating lymphocyte density profiles across the automatically sampled tumour/host front line. ‘We looked at tumours with a slightly different approach,’ Laurinavicius continued. ‘If you want to identify the invasive margin, the question comes as to where should you draw the “invasion line”; you can do it manually, or automatically, but should you outline every gland in every case? If you consider where the fight happens between the host and the tumour, it is a rather irregular area. We explored the concept of extracting an interface zone, rather than just a margin, or a ribbon, of a fixed width between high-level visual features.’
A natural question, he said, was whether the hexagonal tiling could be utilised to detect these interface areas. ‘It took us a while but we implemented this procedure based on single CD8 immunochemistry and digital image analysis.’
For the digital image analysis, the researchers utilised the Indica Labs Halo AI to automatically classify the tissue sample and quantify cells. From the image analysis data they developed a set of rules based on the tissue content within each hexagon, and its surrounding hexagons, to estimate the probability of each hexagon being at the interface. The tumour/stroma edge can then be extracted as those hexagons with high ‘interface-ness’.
The interface zone which reaches both into the tumour and host tissue was established around the edge by ranking hexagons according to their distance to the tumour/stroma edge.
Example: colorectal cancer
In a practical example for colorectal cancer, the interface zone was detected and ranked automatically and immune cell densities in each rank was used to construct an interface profile of the biomarker density. This reveals the immune cells’ ‘gradient towards tumour’ and was named ‘Immunogradient’. Several indicators were used to quantify this, including centre of mass, which is a quantitative feature that tells whether these cells are ‘willing’ to enter the tumour or stop at the edge. ‘We can optimise the method for each type of tumour,’ Laurinavicius explained. ‘For breast cancer, we need a broader zone to collect more data to compute Immunogradient indicators, as there are less lymphocytes. We tested the prognostic value of these indicators. In all prognostic models we have the Immunogradient indicators as independent predictors along with lymph node involvement data in breast cancer and T stage in colorectal cancer. Looking at patient survival probabilities in both cancer cohorts, we see that a good prognostic stratification can actually be achieved by any of the immunogradient family indicators.’
One feature noted in early hormone receptor-positive breast cancer patients was that five years after surgery all patients do quite well with a 92% survival rate but after 10 years there is a dramatic divergence of the two probability curves: high Immunogradient patients maintained 87% survival, while low Immunogradient patients had 55% survival after 10 years. ‘Such knowledge about immune-response properties, obtained from the surgically excised tumour, which predicts long term survival, suggests that these patients should be monitored more closely and could benefit from immunotherapy during the course of their illness,’ Laurinavicius added.
Effective combination of prognostic models
The prognostic models based on tumour heterogeneity, interface and gradient, can be effectively combined, he said.
Finally, Laurinavicius pointed out that frequently spatial heterogeneity indicators of tissue biomarker expression out-performed the prognostic power of the level of the biomarker expression. ‘We found that the gradient at the interface out-performs absolute or relative immune cell density indicators obtained from tumour microenvironment compartments. Furthermore, spatial immunochemistry-based models often are independent of conventional clinical or pathology features; they have good statistical powers, especially if one quantifies the biomarkers by appropriate indicators.’
The webcast also featured a pre-sentation from Doctoral Student Ines Nearchou from the University of St Andrews, Scotland, on ‘International validation of a novel spatial immuno-oncology prognostic model in stage II colorectal cancer’, and from Dr Kate Lillard Tunstall, Chief Scientific Officer with Indica Labs on ‘Spatially-resolved profiling of the tumour immune microenvironment’ who also outlined her company’s HALO spatial analysis tools.
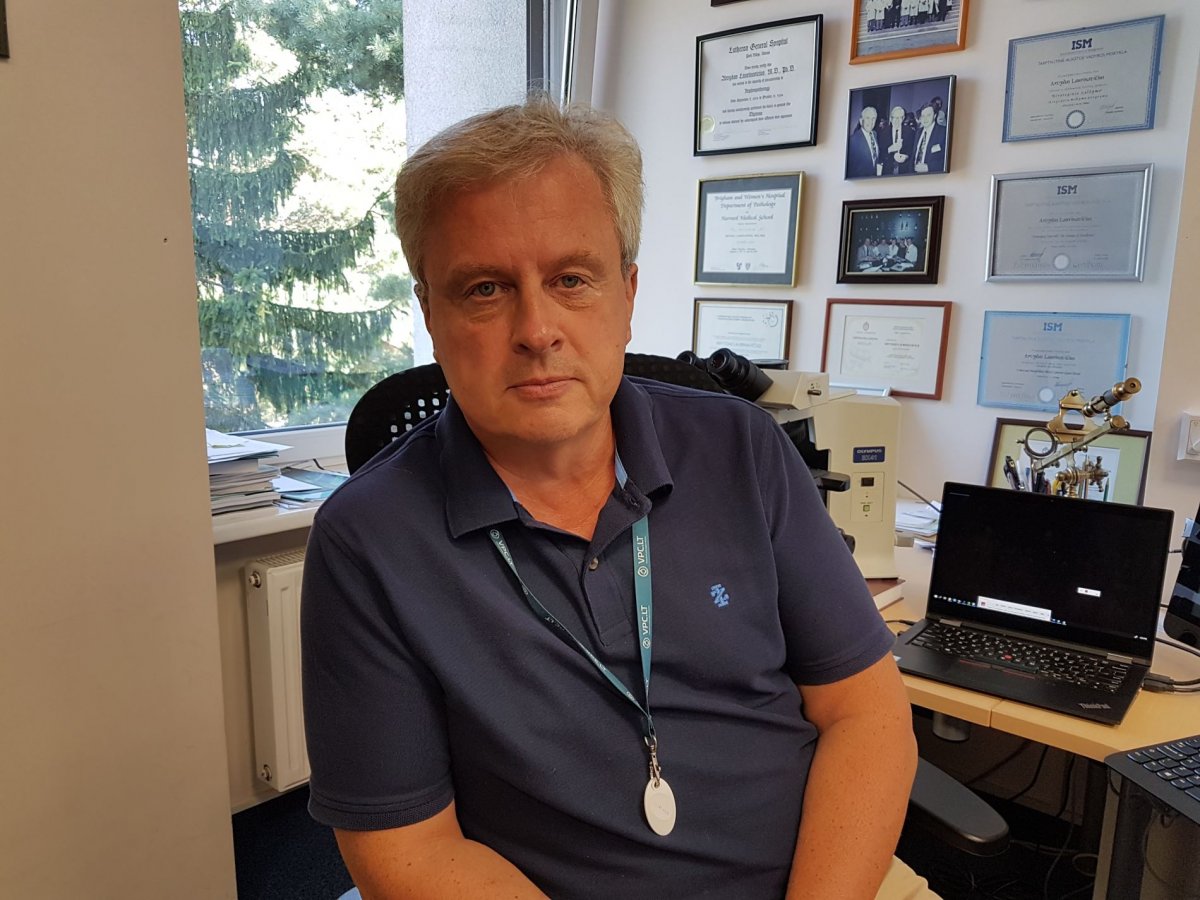
Profile:
Arvydas Laurinavicius is Professor of Pathology at Vilnius University, and Director of the National Centre of Pathology, affiliated to Vilnius University Hospital Santaros Klinikos, in Lithuania. His key areas of interest include renal pathology, digital pathology image analysis, computational pathology, health information systems, standards, testing of cancer biomarkers in tissue, and multi-dimensional disease models. He is currently leading a project funded by the European Social Fund, project No. 09.3.3-LMT-K-712-01-0139 under grant agreement with the Research Council of Lithuania.
17.09.2020